Mālama Mokupuni—Caring for Our Island Environment: Mauna Loa Observatory’s Keeling Curve Reveals Carbon Dioxide Rise to the World
By Rachel Laderman
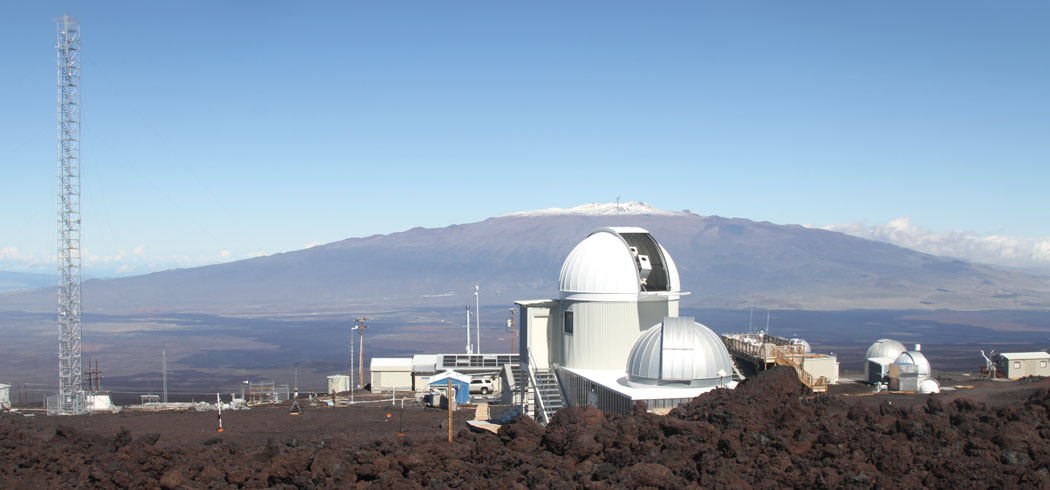
For more than 60 years, at a station perched at 11,000 feet on Mauna Loa, researchers have been meticulously collecting data that has changed our relationship to the earth. Based on their work, we have learned that human-caused carbon dioxide (CO2) emissions are affecting the climate. A CO2 analyzer was first placed there in 1958.
“That instrument, which went up on the side of Mauna Loa in Hawai‘i, is the most important scientific instrument in the world,” says Bill McKibben, leading climate change educator and author. “Beginning in 1959 it found that there was a steadily accumulating amount of CO2 in the atmosphere.”

The Mauna Loa Observatory now tests more than 40 gases plus numerous important parameters such as ultraviolet radiation, ozone, and ozone depleters. The observatory is part of the National Oceanic and Atmospheric Administration (NOAA) Earth System Research Laboratory, Global Monitoring Division.
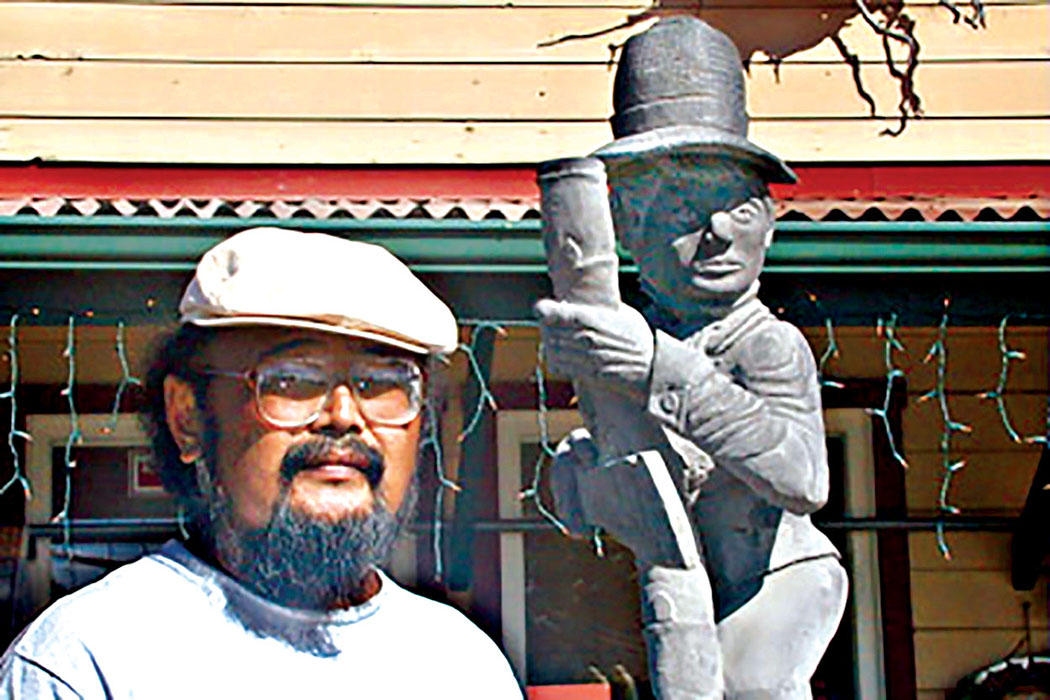
Steve Ryan, a geophysical scientist who joined the observatory in 1989 and managed its CO2 program from 2001 to 2011, provides some history. “In the late 1800s, Swedish scientist Svante Arrhenius calculated that burning coal increases CO2 in the air, and realized that in a few hundred years it would build up in the atmosphere,” he says. The basic chemistry and physics were understood, but measuring devices were inaccurate, and a steady background level was elusive.
In the early 1950s, Charles David Keeling, a postdoctoral student studying CO2 in California, took CO2 sampling to a new level of precision with improved equipment and calibration, which ensures accuracy by comparing results against a standardized, known quantity. He discovered that if he sampled at high elevations, the measurement was steady, due to the mixing of air and distance from pollution and plant life.
The timing was serendipitous; 1957–58 was the International Geophysical Year, during which scientists from 67 countries took coordinated observations of various phenomena. Keeling proposed measuring CO2 at remote locations such as Mauna Loa and the South Pole. The US Weather Bureau and Scripps Institution of Oceanography had a weather station “hut” near Mauna Loa’s summit, and accepted his proposal to add a CO2 monitoring station.
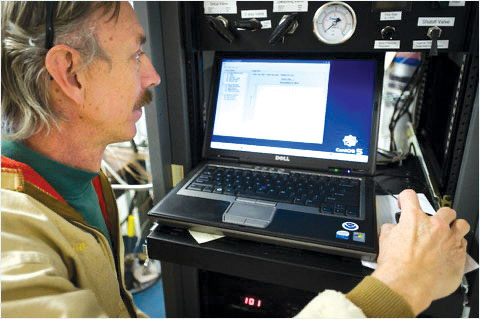
It was also fortunate that Keeling was a very precise researcher. From the beginning, the data was incredibly accurate. As Aidan Colton, who runs the CO2 monitoring program now, explains, “Keeling created a really rigorous calibration cycle, calibrating every hour.”
A Wiggle and a Curve, Seen for the First Time
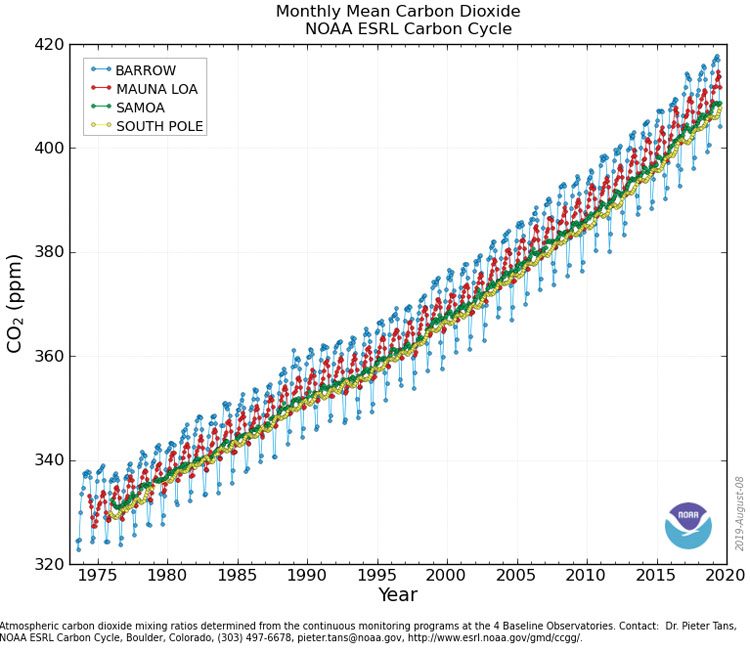
In 1958, with great excitement, the Mauna Loa team made the first clean, steady measurement of CO2, at a concentration of 313 ppm. In the first year, Keeling saw what has become the familiar zigzag cycle of decreasing CO2 in summer and increasing in winter (for the northern hemisphere). This shows the natural, seasonal cycle as plants withdraw CO2 from the atmosphere during summer growth, and release it during winter decay. “This was the first time this annual cycle was seen,” says Steve.
However, Keeling and other scientists also observed a more ominous process. Each year, the baseline level of CO2 increased. The second CO2 analyzer at the South Pole corroborated the Mauna Loa data. Carbon atoms bear the signature of their source as different isotopes, so scientists can tell that the excess CO2 is from human activities such as burning fossil fuels.
The graph showing the climb of CO2 is called the “Keeling Curve,” and is recognized the world over as a symbol of climate change. The Keeling Curve was on the wall in a Harvard University classroom where it inspired student Al Gore to take action. In 2006, he brought the graph further attention in his book and movie An Inconvenient Truth.
Why Mauna Loa—and What about Vog?
Why is the side of an active volcano a good place to measure air quality? “The station is above the trade wind temperature inversion and day-to-day weather changes, capturing the flow of almost pristine air,” explains Steve. It is an ideal location, set amidst barren lava, thousands of feet above vegetation or pollution sources, far from other continents.
“We’re measuring the most well-mixed air we can find,” says Aidan. He describes that it is the baseline data that they want, not the spikes or dips. “The reason for sampling at Mauna Loa is that our location allows us to exclude everything going on locally—our weather is often independent of the local conditions.”
The data is robust, fortified with approximately 96 weekly flask-sampling stations across the globe, plus satellite data. NOAA operates three other continuous CO2 monitoring stations along roughly the same longitude (see graph). Steve has the distinction of having worked at all four of the stations. NOAA started its own measurement at Mauna Loa in 1974, further solidifying the data. “Within our facility there are two separate, independent CO2 monitoring projects, showing exactly the same thing, one run by Scripps, the other by NOAA,” Aidan explains.
Latest Trend
The Keeling Curve is not only steadily rising; it is rising faster. In October 2019, an international press release again led with Mauna Loa data. A new record was reached of 410 ppm. “It was 340 ppm when I started measuring,” says Steve. “I’ve seen it increase by 70 ppm in my career.”
Even with numerous other sampling sites, Mauna Loa’s sawtooth graph is still used as shorthand for the most significant climate measurement of our time. ❖
For more information: esrl.noaa.gov/gmd/ccgg/trends/
Rachel Laderman, Sustainable Pacific Program, Lynker LLC/NOAA Affiliate, Hawai‘i Island